

A marketing dashboard should show the handful of numbers that tell you whether marketing is bringing in customers at a price you can afford: leads, cost per lead, revenue by channel, conversion rate, customer acquisition cost and returning customers. Everything else is detail for the channel owner. Below are the six numbers, five example layouts by business type, a comparison of the main tools and a free Looker Studio template you can copy in two minutes.
Key takeaways
- A marketing dashboard is one page you open every Monday to decide what to fix this week, not a monthly report.
- Six numbers run most small businesses: leads, cost per lead, revenue by channel, conversion rate, CAC and returning customers.
- Keep the top row the same for every business; change only the second row by business type.
- Google’s free Data Studio (formerly Looker Studio) is enough for most small businesses on Google Ads and GA4.
- Most dashboards fail because nobody owns them. Put a 20-minute monthly review in the calendar.
On this page
- What is a marketing dashboard?
- The 6 numbers every small business dashboard needs
- Marketing dashboard examples by business type
- Which marketing dashboard tool should you use?
- How to build a marketing dashboard in an afternoon
- Free marketing dashboard template
- Mistakes that make dashboards useless
- Frequently asked questions
- Sources and method
What is a marketing dashboard?
A marketing dashboard is a single page that pulls your marketing data from ads, analytics, email and sales into one view that updates on its own. Its job is to answer one question quickly: is marketing working, and if not, where is it breaking?
A dashboard is not the same as a report. A report explains what happened last month; a dashboard is what you open on Monday morning to decide what to fix this week. If you are still choosing what to measure, start with our marketing KPI examples, then put the winners on the dashboard.
The 6 numbers every small business marketing dashboard needs
Most small businesses can run marketing from six numbers. Put them at the top of the page, each with last month and the same month last year beside it.
| Number | Formula | Why it is on the dashboard |
|---|---|---|
| Leads | Calls + forms + bookings + chats in the period | The first sign that marketing is or is not producing demand |
| Cost per lead | Ad spend ÷ leads from ads | Shows which channel buys demand cheaply and which wastes budget |
| Revenue by channel | Sales value grouped by the source of the first or last touch | Tells you where the money comes from, not just the clicks |
| Conversion rate | Leads ÷ website sessions × 100 | Falls first when a page, form or offer breaks |
| Customer acquisition cost (CAC) | Total marketing and sales cost ÷ new customers | The real price of a customer, to compare with what a customer is worth |
| Returning customers | Repeat customers ÷ all customers × 100 | Cheap growth that ad dashboards miss |
For one Bay Area HVAC client, the cost per lead line is what showed the change: a rebuilt water heater campaign has averaged $34 per lead against a typical $200–250 for HVAC leads in that market (HVAC case study). Without the number on one page, that win would have been buried in an ads report.
Add a seventh line only when a decision depends on it. AI search is the most common candidate in 2026: AI citations and referral sessions from AI assistants, explained in our KPI guide.
Marketing dashboard examples: 5 layouts by business type
The six numbers stay the same; what changes by business type is the second row, the detail you need to act on them. Use the layout closest to your business and delete what you will not look at.
| Business type | Top row (the decision numbers) | Second row (where to act) | Typical data sources |
|---|---|---|---|
| Local service business (HVAC, legal, clinics) | Calls and bookings, cost per lead, booked jobs | Leads by service and by day of week, missed calls, Google Business Profile actions | Google Ads, GA4, call tracking, Google Business Profile |
| Ecommerce | Revenue, orders, return on ad spend, conversion rate | Revenue by channel and by product, average order value, returning customers | GA4, Shopify or WooCommerce, Google Ads, Meta Ads |
| B2B lead generation | Qualified leads, cost per qualified lead, pipeline value | Leads by source, lead-to-meeting rate, deals won | CRM (HubSpot, Pipedrive), Google Ads, LinkedIn Ads, GA4 |
| Agency client report | The client’s goal KPI, spend vs budget, cost per result | Channel breakdown, what changed this month, next steps | All ad platforms, GA4, the client’s CRM |
| SEO and AI search | Organic leads, non-brand clicks, AI citations | Top landing pages, queries gaining and losing, pages cited by AI | Search Console, GA4, Bing Webmaster Tools, Microsoft Clarity |
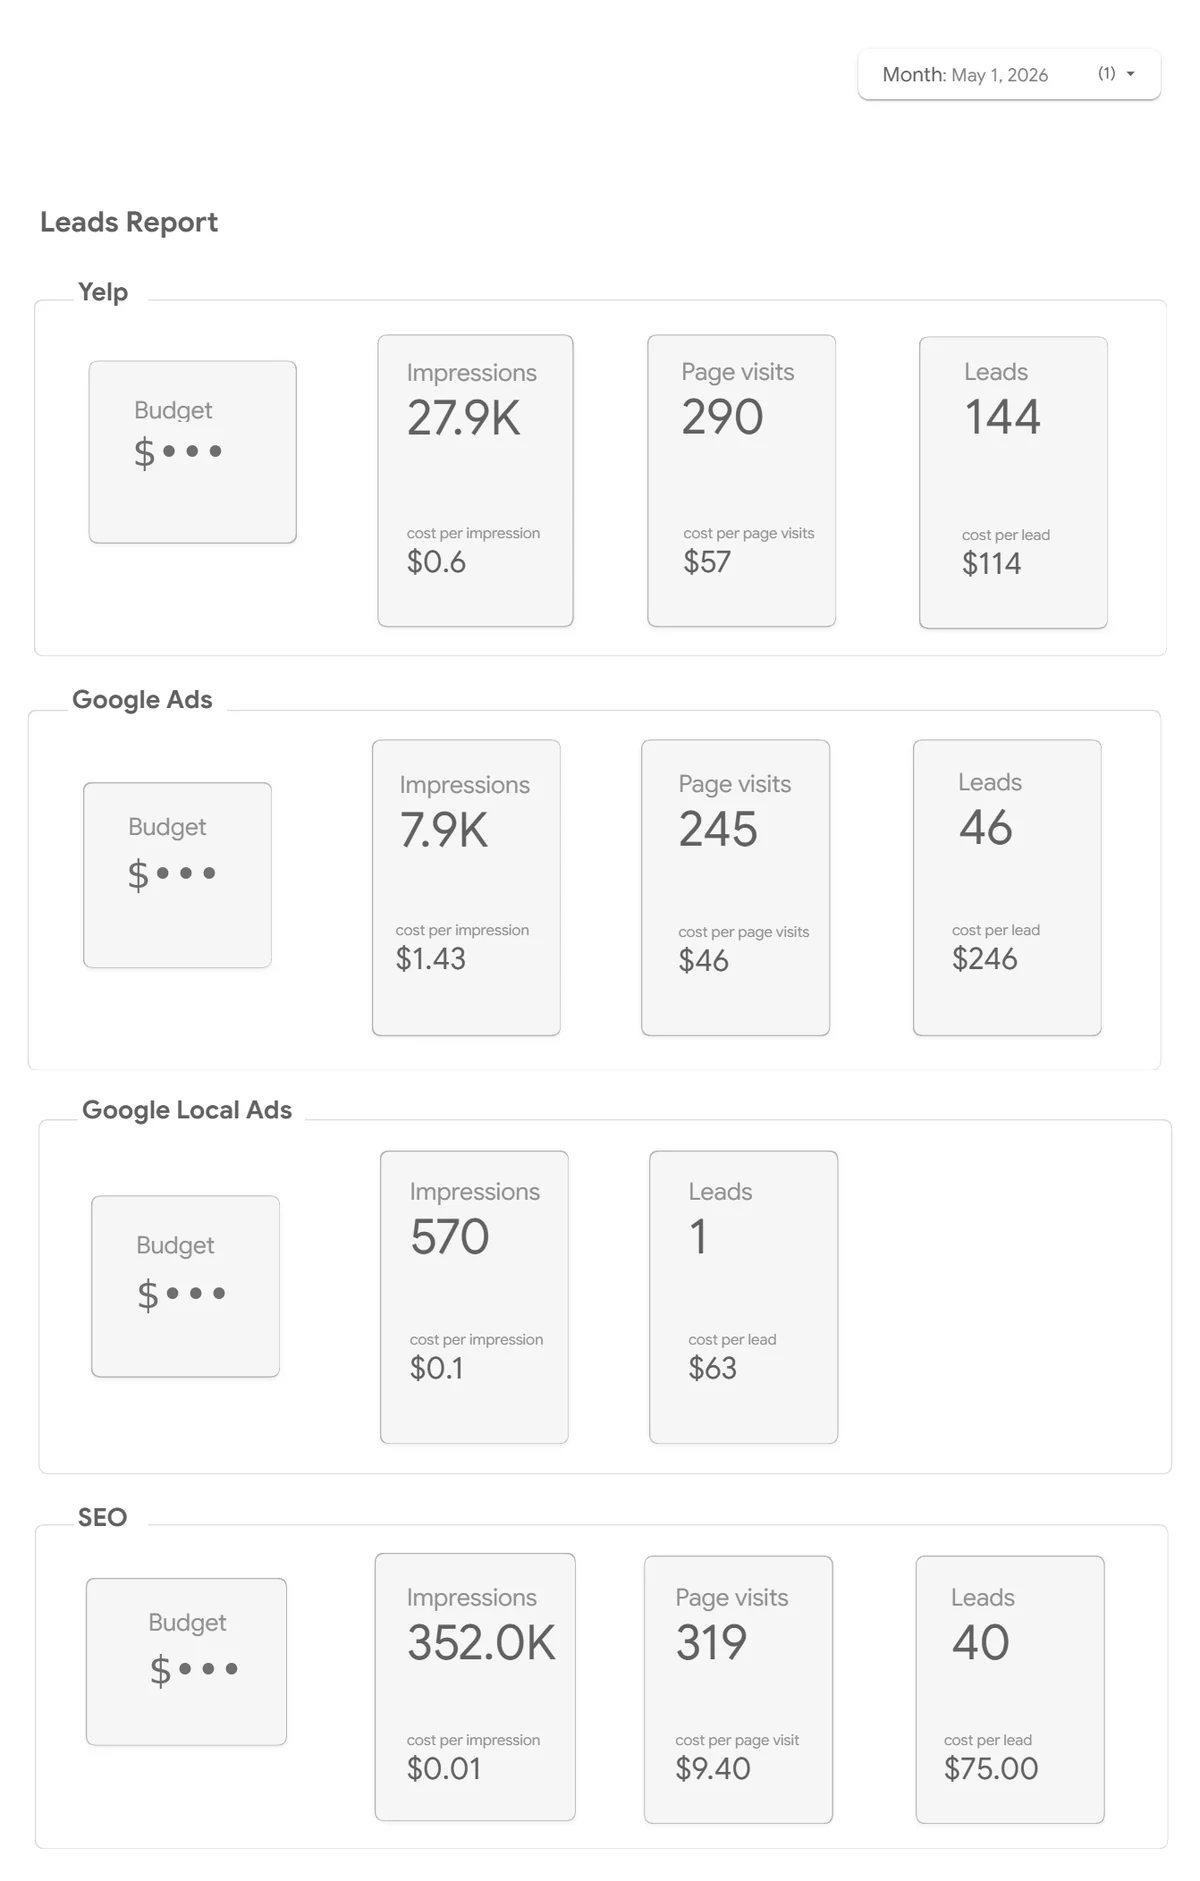
This is the simplest version of the local service layout: the same four numbers for every channel, so the owner can compare Yelp, Google Ads, Local Ads and SEO for the month without opening four platforms. Leads by service, missed calls and booked jobs are the next row to add.
For an agency, the client report layout is the one that keeps the relationship: the first line should be the number the client cares about, not the number the agency is proud of.
Which marketing dashboard tool should you use?
For most small businesses the answer is Google’s free Data Studio, the tool most people still know as Looker Studio: it connects to Google Ads, GA4 and Search Console at no cost and can be shared with a link. Pay for a tool only when you need what the free one lacks, such as many non-Google sources, alerts or a CRM in the same place.
| Tool | Price (US list, checked 9 Nov 2026) | Data sources | Best for | Learning curve |
|---|---|---|---|---|
| Data Studio (formerly Looker Studio) | Free; Pro $9 per user per project per month (Google) | Google sources built in; others through partner connectors, often paid | Small businesses on Google Ads and GA4; client reports | Low to medium |
| GA4 explorations | Free (the paid GA4 360 is for large companies) | Website and app data only | Digging into one question about site behaviour | Medium |
| HubSpot Marketing Hub | Free and Starter ($9 per seat per month, annual); custom dashboards from Professional, $800 per month with 3 seats (HubSpot) | HubSpot CRM, email, forms, ads | Teams that already run sales in HubSpot | Low |
| Databox | Free for 3 sources; Pro $159 per month, unlimited users (Databox) | Ready connectors for common ad, analytics and CRM tools | Agencies and owners who want ready-made dashboards fast | Low |
| Power BI | Free to build; sharing needs Pro, $14 per user per month, annual (Microsoft) | Almost anything, including Excel and databases | Companies already on Microsoft 365 with someone who knows it | High |
Prices change often; the table shows the vendor’s own published price on the date above, before tax. Google’s documentation now says Looker Studio is called Data Studio, so you will see both names in menus and help pages.
How to build a marketing dashboard in an afternoon
You can build a working dashboard in three to four hours if the tracking underneath already works. Most of the time goes into steps 1 and 2, not into charts.
- Write down the decisions. List the three or four decisions you make each month, such as moving budget between channels or pausing a campaign. Every chart must help one of them.
- Check the tracking. Make sure calls, forms and bookings are recorded as conversions in GA4 and Google Ads, and that the numbers roughly match your CRM or inbox. A dashboard on broken tracking is worse than none. Our guide to what to measure in web analytics covers the setup.
- Copy the template. Open our free template, choose Make a copy from the three-dot menu and point it at your own data: the sample sheet with your numbers, or your GA4 property.
- Put the six numbers at the top. One scorecard each, compared with the previous period and the same month last year.
- Add the second row for your business type. Use the layout from the examples above; stop at about ten charts.
- Set the date range and share it. Default to last month, share with view access, and book 20 minutes on the first Monday of each month to read it.
Free marketing dashboard template (Looker Studio / Data Studio)
The template has a top row of six scorecards (sessions, leads, conversion rate, ad spend, cost per lead and revenue), a weekly trend of leads and sessions, a table by channel and filters for date and channel. It runs on a Google Sheet with 90 days of sample data for a small service business, so it opens without any logins. Open the template or see the PDF preview first.
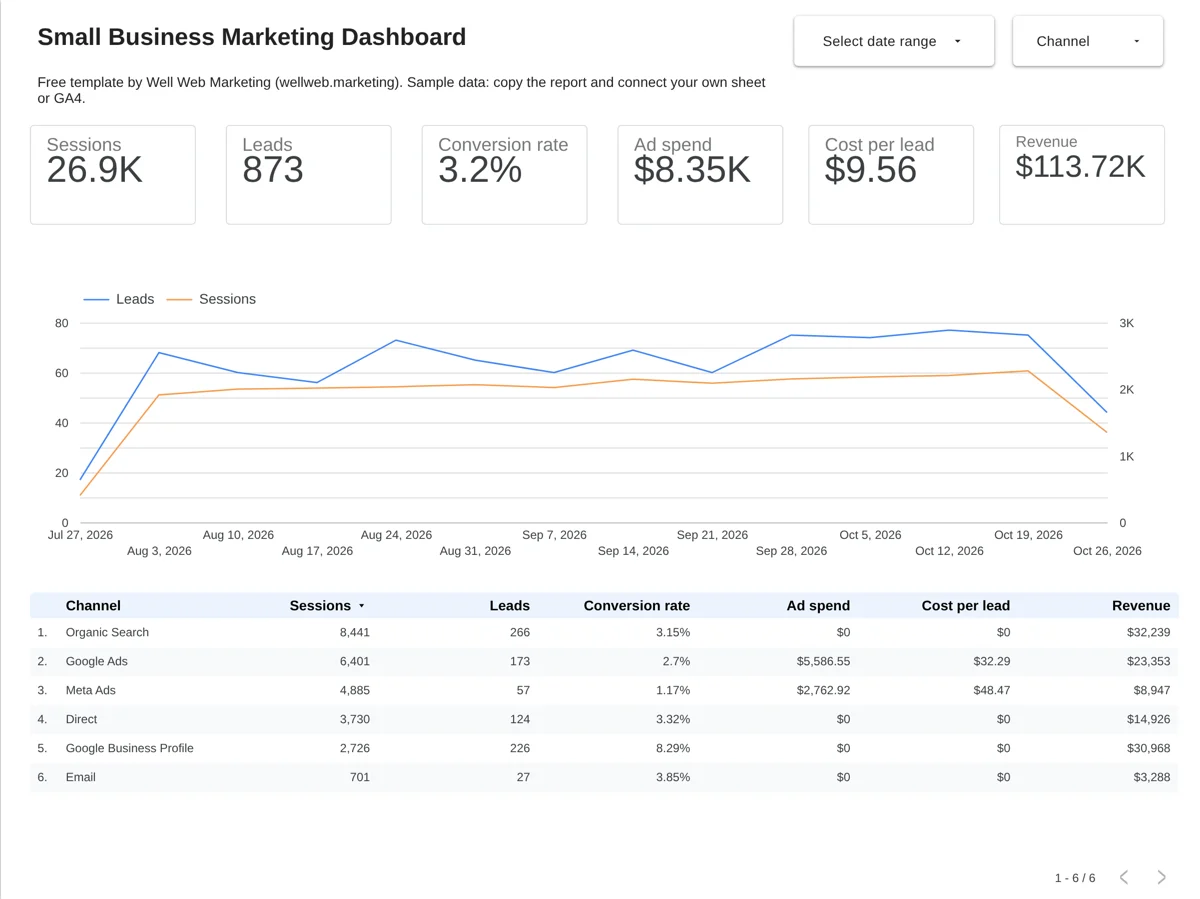
To use it with your own numbers, open the template, choose Make a copy from the three-dot menu, then copy the sample data sheet and replace the rows with yours (one row per day per channel). The second page of the report explains how to switch the data source to GA4 instead. CAC and returning customers need data from your CRM or shop, so add them once that data is in the sheet.
If you would rather not build it yourself, our marketing dashboard setup checks your tracking and delivers a finished dashboard at a fixed price.
Mistakes that make marketing dashboards useless
Most dashboards fail because nobody acts on them, not because the charts are wrong. These are the six mistakes we see most often:
- Too many charts. Thirty charts on one page means nobody knows which number to fix first. Keep the top row to six.
- Vanity metrics on top. Impressions, followers and sessions belong lower down; leads, cost per lead and revenue go first.
- No comparison. A number without last month or last year beside it cannot tell you whether things got better.
- Broken or double-counted conversions. If GA4 and Google Ads both count the same lead, or a thank-you page fires twice, every number below is wrong.
- Each platform judging itself. Google Ads, Meta and email each claim the same sale. Use one source of truth for revenue, and read our guide to attribution models before you move budget.
- Nobody owns it. A dashboard without a fixed monthly review becomes a link nobody opens. Put the review in the calendar.
Frequently asked questions
For most small businesses it is Google’s free Data Studio, formerly Looker Studio, because it connects to Google Ads, GA4 and Search Console at no cost. HubSpot suits teams already selling through HubSpot, Databox suits people who want ready-made dashboards, and Power BI suits companies already on Microsoft 365.
Yes. In Data Studio you share a report by link or email with view-only access, so clients see live numbers but cannot change anything. In Power BI, sharing reports needs a paid Pro or Premium licence.
Once a month for decisions about budget and channels, and once a week for a two-minute look at leads and spend. Daily checking mostly shows noise, especially on small budgets.
An SEO dashboard tracks organic search on its own: non-brand clicks, leads from organic visits, top landing pages and queries that are gaining or losing. In 2026 it should also show AI citations from Bing Webmaster Tools, because AI answers now take clicks that used to go to search results.
Not sure your tracking is right, or no time to build it? Our marketing dashboard setup fixes the tracking and hands you a finished dashboard, at a fixed price and a fixed date.
Sources and method
- Google Cloud, Data Studio pricing, checked 9 November 2026.
- Google Cloud documentation, Data Studio Pro subscription overview: Looker Studio is now called Data Studio.
- HubSpot, Marketing Hub pricing guide, updated 14 September 2026.
- Databox, How to choose the right Databox plan, updated 24 September 2026.
- Microsoft, Power BI pricing, checked 9 November 2026.
- Well Web Marketing, HVAC marketing case study.