Top Marketing Dashboard Examples to Boost Your Data Insights
Unleash the Power of Your Marketing Data
Stop drowning in data and start making decisions that drive growth. This listicle provides 8 marketing dashboard examples to help you visualize your key metrics and gain actionable insights. Struggling to understand your marketing performance? Tools like Tableau, Google Data Studio, and Databox, among others, transform raw data into understandable reports. Explore these marketing dashboard examples and discover how to build dashboards that fuel your marketing success.
1. Tableau
Tableau earns its spot on this list of top marketing dashboard examples due to its robust data visualization and business intelligence capabilities. It empowers marketers to transform raw data into actionable insights by creating interactive and visually appealing dashboards. With its drag-and-drop interface, even users with limited technical expertise can build compelling visualizations to track key performance indicators (KPIs). This makes it a valuable tool for SMEs, startups, and corporate marketing teams alike, enabling data-driven decision-making across the board. Its ability to connect to various data sources, from CRM platforms and Google Analytics to social media channels, provides a holistic view of marketing performance. This comprehensive perspective is crucial for understanding the customer journey and optimizing campaigns for maximum impact. Tableau’s real-time data integration allows marketers to monitor performance as it happens, facilitating agile responses to changing market conditions.
For example, an e-commerce business can use Tableau to build a marketing dashboard that tracks website traffic, conversion rates, average order value, and customer acquisition cost across different marketing channels. By visualizing this data, they can identify which channels are driving the most profitable customers and optimize their marketing spend accordingly. A startup, on the other hand, might leverage Tableau to monitor social media engagement, brand mentions, and website traffic following a new product launch, providing real-time feedback on campaign effectiveness.
Tableau offers a range of features that cater to diverse marketing needs:
- Interactive Data Visualization: The drag-and-drop interface makes it easy to create custom dashboards without coding, allowing marketers to explore data and uncover hidden trends.
- Real-time Data Integration: Connect to various data sources, including CRM platforms, Google Analytics, social media APIs, and databases, for a comprehensive view of marketing performance.
- Advanced Analytics: Leverage AI-powered insights and predictive analytics to forecast future trends and optimize marketing strategies.
- Mobile-Friendly Dashboards: Access and share dashboards on any device, enabling on-the-go monitoring and collaboration.
- Sharing and Collaboration: Easily share dashboards with team members, stakeholders, or clients to foster data-driven decision-making across the organization.
Pros:
- Powerful Visualization: Creates highly interactive and visually appealing dashboards that effectively communicate complex data.
- Scalability: Handles large datasets efficiently, making it suitable for businesses of all sizes.
- Community Support: Benefits from a large and active community, offering ample learning resources and support.
- Enterprise-Grade Security: Robust security features protect sensitive data.
Cons:
- Learning Curve: Can be challenging for beginners to master the full functionality of the platform.
- Pricing: Tableau’s pricing can be higher compared to some other business intelligence tools.
- Resource Intensive: Complex dashboards can require significant computing resources.
- Customization: Advanced customizations may require technical expertise.
Pricing: Tableau offers various pricing plans based on user type and deployment options. Contact Tableau directly for detailed pricing information.
Implementation Tips:
- Start with a clear objective: Define the key metrics you want to track and the insights you want to gain.
- Utilize Tableau’s extensive online resources: Take advantage of tutorials, webinars, and community forums to learn best practices.
- Start small and iterate: Begin with a simple dashboard and gradually add complexity as you become more familiar with the platform.
2. Google Data Studio (Looker Studio)
Google Data Studio, now rebranded as Looker Studio, is a powerful, free reporting tool that transforms raw marketing data into easily digestible, visually appealing dashboards and reports. Its seamless integration with other Google marketing products like Google Analytics, Google Ads, and Google Search Console makes it an invaluable asset for businesses seeking a unified view of their online marketing performance. This makes it a prime example of a versatile marketing dashboard, perfect for demonstrating the potential of data visualization in driving informed decision-making. For SMEs, startups, and even corporate marketing teams, Looker Studio offers the ability to track key performance indicators (KPIs) and gain actionable insights without the hefty price tag often associated with enterprise-level analytics platforms.
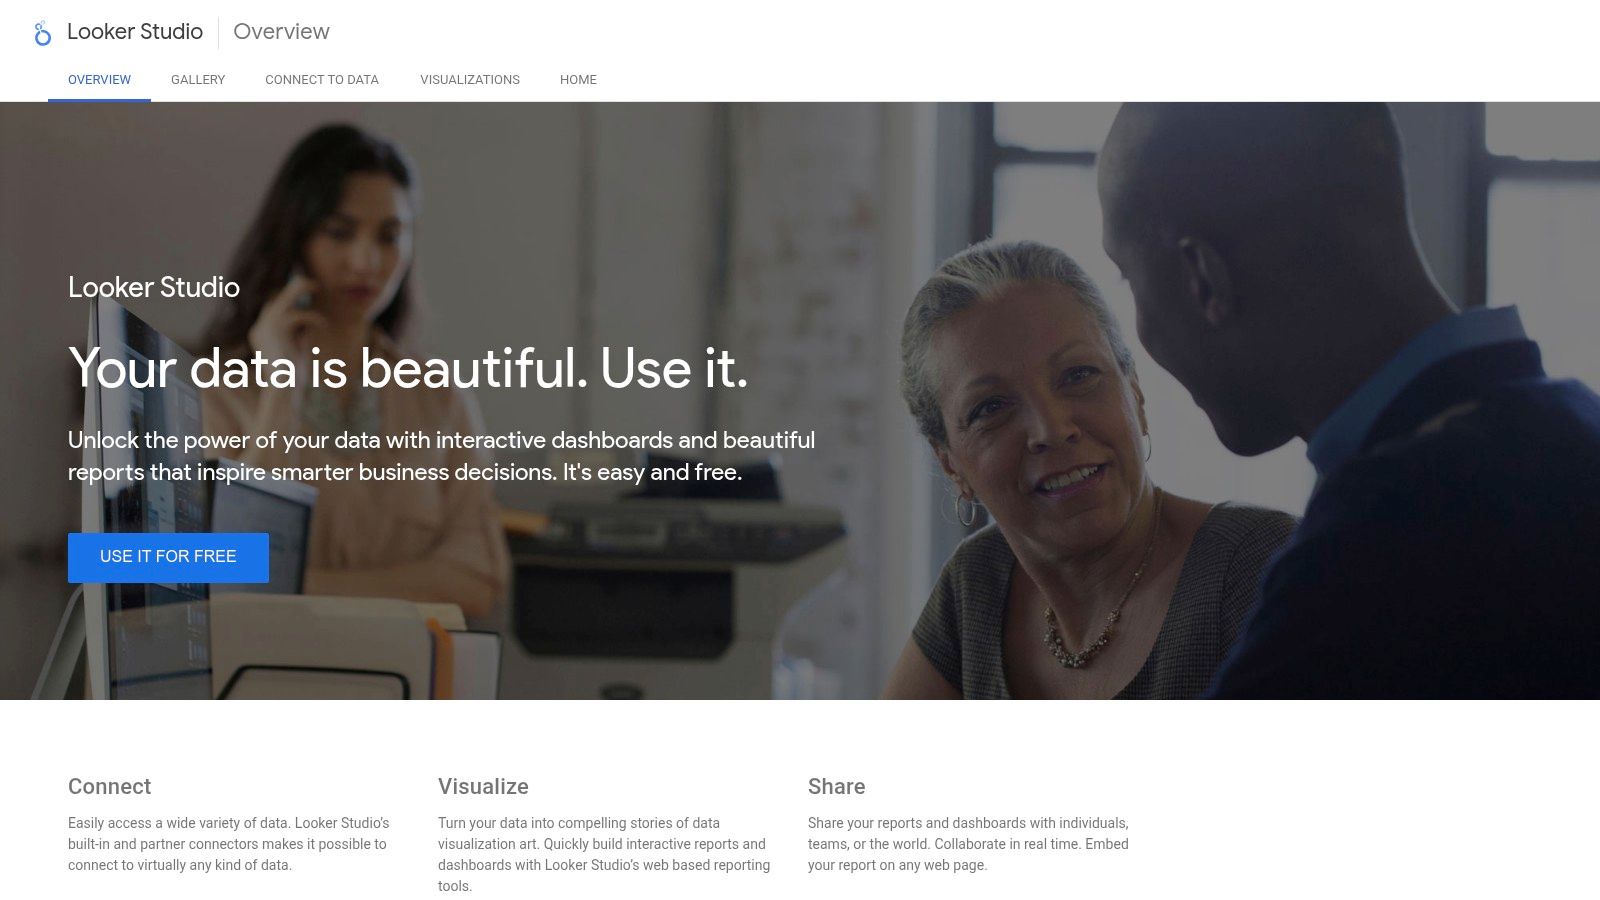
Looker Studio’s customizable dashboards allow marketers to visualize campaign performance, website traffic, conversion metrics, and audience behavior patterns. Imagine an e-commerce business wanting to understand the effectiveness of their latest social media campaign. With Looker Studio, they can create a dashboard showcasing metrics like click-through rates, conversion rates from social media traffic, and the overall revenue generated from the campaign. Similarly, a local business can track website traffic sources, identifying which marketing channels are driving the most foot traffic to their store. The platform’s interactive filtering and date range controls further enhance analysis, allowing users to drill down into specific data segments and identify trends over time. Real-time data collaboration and sharing features facilitate seamless communication and ensure that everyone within the team is working from the same data-driven insights. This is especially beneficial for marketing teams distributed across different locations.
Features:
- Native integration with Google marketing products (Google Analytics, Google Ads, Search Console)
- Customizable dashboard templates for various marketing metrics
- Real-time data collaboration and sharing
- Interactive filtering and date range controls
- Free to use with unlimited reports
- Wide range of third-party connectors (some require payment)
Pros:
- Free platform with robust reporting capabilities
- Excellent integration with the Google marketing ecosystem
- User-friendly interface requiring minimal training
- Easy sharing and collaboration features
Cons:
- Limited advanced analytics capabilities compared to paid business intelligence tools like Tableau or Power BI
- Can experience performance issues with very large datasets
- Some third-party connectors require payment
- Less sophisticated data blending options compared to more advanced platforms
Implementation Tips:
- Start with a pre-built template for your specific marketing needs. Looker Studio offers a range of templates for common use cases.
- Connect your relevant Google marketing platforms. The native integration makes this process incredibly straightforward.
- Customize your dashboards to focus on the KPIs most relevant to your business objectives.
- Regularly review and update your dashboards to ensure the data remains accurate and insightful.
- Utilize the sharing features to collaborate with your team and stakeholders.
Website: lookerstudio.google.com
Looker Studio deserves its place in this list because it provides a robust, free solution for businesses of all sizes to create impactful marketing dashboards. While it may not offer the advanced analytics capabilities of some paid tools, its ease of use, seamless Google integration, and real-time collaboration features make it an excellent choice for organizations looking to leverage data visualization for better marketing decision-making. It’s particularly valuable for SMEs and startups looking for cost-effective marketing dashboard examples that can be implemented quickly and easily.
3. Databox
Databox secures its spot on this list of top marketing dashboard examples due to its specialized focus on marketing data visualization and reporting. It simplifies the process of pulling data from disparate sources and presenting it in a clear, actionable format. This makes it a valuable tool for SMEs, startups, and even larger marketing teams looking for a straightforward way to monitor their key performance indicators (KPIs) and track progress towards their goals. Instead of juggling multiple platforms and spreadsheets, Databox offers a centralized hub for all your essential marketing data. This allows you to quickly identify trends, spot potential issues, and make data-driven decisions to optimize your campaigns.
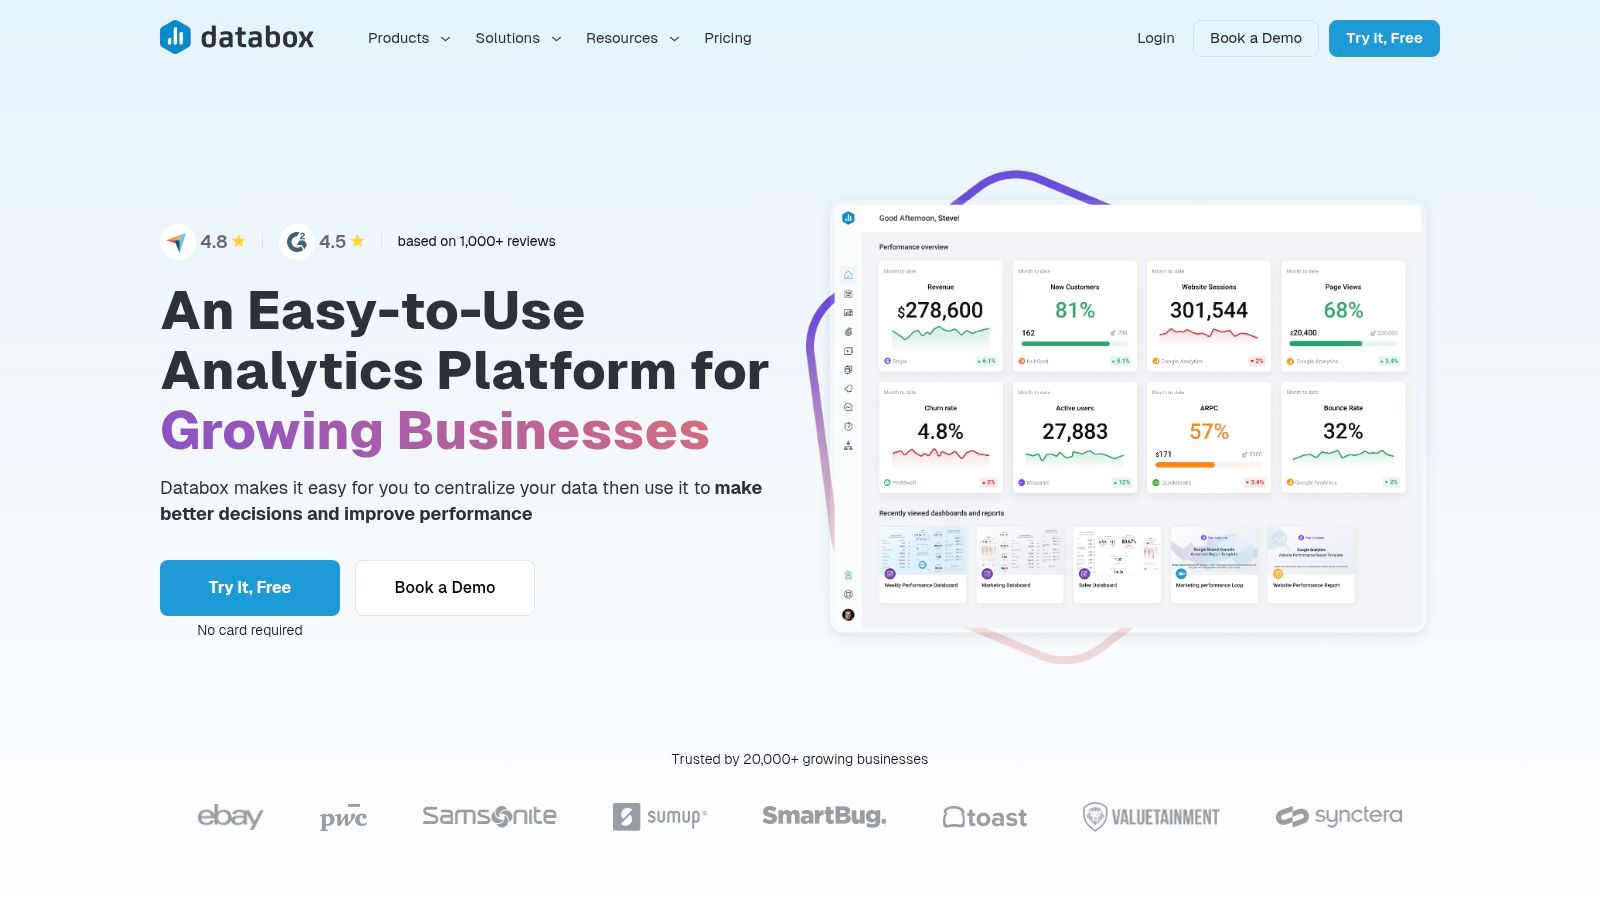
One of Databox’s standout features is its extensive library of 500+ pre-built dashboard templates catering to various marketing needs. Whether you’re tracking SEO performance, social media engagement, or paid advertising ROI, you’ll likely find a template that fits your requirements. This significantly reduces the time and effort required to set up your dashboards, allowing you to start monitoring your data quickly. Furthermore, its drag-and-drop interface makes customization easy, even for those without technical expertise. You can easily add, remove, or rearrange metrics to create a dashboard that perfectly reflects your specific needs.
For busy marketers and agencies, Databox’s automated reporting features are invaluable. The platform can automatically generate and deliver daily, weekly, or monthly scorecard emails, keeping stakeholders informed of key metrics without manual intervention. The robust alert and notification system ensures you’re immediately notified of significant changes in your metrics, allowing for proactive adjustments and timely optimization. For example, if your website traffic suddenly drops or a specific campaign’s conversion rate plummets, you’ll receive an alert prompting you to investigate and take corrective action.
While Databox excels in its ease of use and pre-built templates, it’s important to be aware of some limitations. Advanced data manipulation and custom metric calculations can be challenging within the platform. While suitable for most SMEs and growing businesses, very large enterprises with complex data analysis needs might find Databox less flexible than some other enterprise-level business intelligence platforms. Some users also report occasional delays in data refreshes, which can be a concern if you require real-time data updates.
Features:
- 500+ pre-built dashboard templates for marketing metrics
- Automated daily/weekly/monthly scorecard emails
- Goal tracking with alerts and notifications
- Mobile app for on-the-go analytics
- Data integration from 70+ marketing platforms
Pros:
- Intuitive drag-and-drop dashboard builder
- Excellent library of pre-built marketing templates
- Affordable pricing tiers for different team sizes
- Strong alert and notification system
Cons:
- Limited advanced data manipulation features
- Some users report occasional data refresh delays
- Custom metrics calculations can be challenging
- Less suitable for very large enterprise needs
Website: databox.com
Databox offers a range of pricing tiers to accommodate various team sizes and budgets, starting with a free plan for individual users. Paid plans offer more features, data sources, and user accounts. For specific pricing details, it’s best to consult their website. Implementing Databox is generally straightforward, involving signing up, connecting your data sources, and selecting or customizing a dashboard template. Their website provides helpful resources and support documentation to guide you through the setup process. Overall, Databox presents a strong option for businesses seeking a user-friendly and dedicated platform for building effective marketing dashboards and streamlining their reporting workflows.
4. Looker (Google Cloud)
Looker, now integrated into Google Cloud, is a robust business intelligence and data analytics platform ideal for creating sophisticated marketing dashboards. It empowers marketers to glean in-depth insights from their data, moving beyond vanity metrics and towards actionable strategies. Looker’s key differentiator is its proprietary modeling language, LookML, which allows you to define metrics once and reuse them consistently across various dashboards, ensuring data integrity and saving valuable time. This makes it particularly useful for tracking complex campaigns and understanding customer behavior across multiple touchpoints. For instance, you could define a metric for “Customer Lifetime Value” once in LookML, and then easily incorporate it into dashboards focusing on customer acquisition cost, campaign ROI, or customer segmentation, ensuring consistent reporting across your marketing team. This level of data consistency is crucial for accurate analysis and informed decision-making.
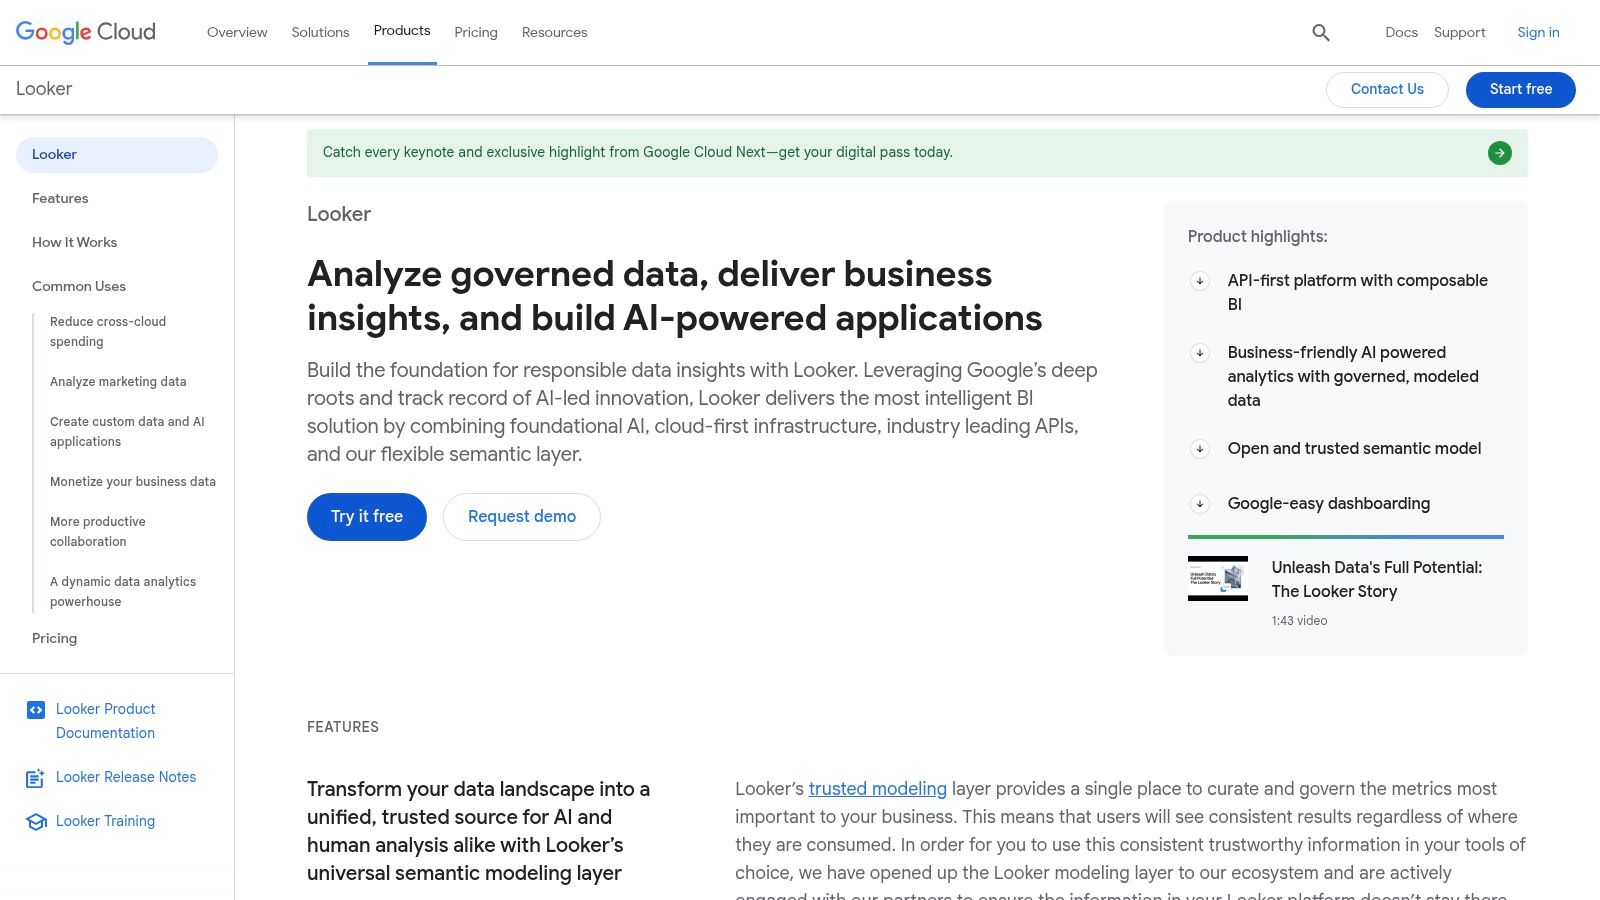
Looker excels at providing marketing teams with a single source of truth, enabling cross-filtering and drill-down capabilities for deep data exploration. Imagine analyzing the performance of a specific social media campaign. With Looker, you can not only see the overall engagement metrics but also drill down to analyze performance by demographic, geographic location, or even individual posts. This granular level of analysis helps pinpoint what resonates with your audience and optimize future campaigns for better results. Furthermore, its embedded analytics feature allows you to integrate these dashboards into other applications, streamlining workflows and making data-driven insights readily accessible. For example, you could embed a Looker dashboard displaying key marketing KPIs directly into your CRM system, providing your sales team with valuable context and improving cross-functional collaboration.
While Looker offers powerful data modeling and robust data governance, it’s essential to consider its suitability for your specific needs. This platform is a particularly strong choice for enterprise-level organizations with complex data structures and the technical resources to leverage LookML. The initial learning curve for LookML can be steep, requiring dedicated training and potentially specialized personnel. Smaller marketing teams with limited budgets might find the higher price point a barrier, especially when simpler, more affordable marketing dashboard examples exist. Although pricing isn’t publicly available, Looker positions itself towards enterprise clients, suggesting a higher cost than many alternatives. Implementation typically requires technical expertise, either in-house or through a Google Cloud partner. Therefore, smaller organizations should carefully evaluate their resources and budget before committing to Looker.
Despite the higher cost and technical requirements, Looker earns its place on this list due to its unparalleled data modeling capabilities, deep integration with Google Cloud Platform, and advanced analytics features. If your organization has complex data needs, requires rock-solid data governance, and is willing to invest in the technical resources required, Looker can be a game-changer for your marketing analytics. You can explore more details and request a demo on their website: looker.com/.
5. Domo
Domo stands out as a powerful cloud-based business intelligence platform specifically designed for creating comprehensive marketing dashboards. It excels at connecting diverse data sources, offering over 1,000 pre-built connectors to consolidate information from various marketing channels into a single, unified view. This makes it a robust solution for businesses looking to gain a holistic understanding of their marketing performance. Domo’s ability to handle massive datasets without sacrificing dashboard responsiveness is a key differentiator, enabling marketers to track real-time campaign performance, customer engagement, and marketing ROI across all their initiatives. This positions Domo as a valuable tool for data-driven decision-making and optimizing marketing strategies. One of the most significant advantages for those seeking robust marketing dashboard examples is Domo’s ability to seamlessly integrate data from virtually any source, providing a truly comprehensive overview of marketing performance.
Domo’s features are tailored for in-depth marketing analysis. Its built-in ETL (Extract, Transform, Load) capabilities simplify data preparation and cleansing, allowing marketers to focus on analysis rather than data wrangling. The card-based visualization system offers flexibility in dashboard customization, enabling users to create highly personalized views of their key metrics. Domo Buzz, a built-in social collaboration tool, facilitates team communication and knowledge sharing directly within the platform, promoting data-driven discussions and informed decision-making. Furthermore, Domo’s mobile-first design makes it easy to access and analyze data on the go, keeping marketers connected to their insights regardless of location.
For SMEs and startups, Domo can provide enterprise-grade analytics capabilities, but the premium pricing might be a significant consideration. For corporate marketing teams and e-commerce businesses, Domo’s capacity to handle large datasets and connect to various marketing platforms makes it a compelling option for comprehensive performance tracking and ROI analysis.
Features:
- 1,000+ data connectors for marketing platforms (e.g., Google Analytics, Facebook Ads, Salesforce)
- Built-in ETL (Extract, Transform, Load) capabilities
- Card-based visualization system for flexible dashboards
- Domo Buzz for team collaboration and discussion
- Mobile-first design philosophy
Pros:
- Exceptional data connectivity options
- Handles extremely large datasets efficiently
- Strong mobile experience for on-the-go insights
- Built-in social collaboration features
Cons:
- Premium pricing model may be prohibitive for smaller teams
- Steeper learning curve compared to some other platforms
- Advanced customizations can require technical expertise
- Customer support quality can sometimes be inconsistent
Implementation Tips:
- Start with a clear understanding of your key marketing metrics and KPIs.
- Leverage Domo’s pre-built connectors to quickly integrate your existing marketing data sources.
- Explore the card-based visualization system to create custom dashboards tailored to your specific needs.
- Utilize Domo Buzz to foster collaboration and data-driven discussions within your team.
Domo earns its place on this list of marketing dashboard examples due to its robust data connectivity, scalability, and advanced analytics capabilities. While the pricing might be a concern for smaller organizations, larger businesses and those with complex data needs will find its comprehensive features invaluable for driving data-driven marketing strategies. It allows businesses to move beyond basic reporting and delve into deeper insights, uncovering hidden trends and optimizing campaigns for maximum impact.
6. Power BI
Microsoft Power BI earns its place on this list of top marketing dashboard examples because it offers a robust and versatile solution for visualizing and analyzing marketing data. It empowers businesses, from startups to enterprises, to transform raw data into actionable insights that drive strategic decision-making. Power BI connects to a vast array of data sources, allowing marketers to monitor everything from website traffic and social media engagement to campaign performance and sales conversions, all within a single, unified view. This comprehensive approach makes it easier to identify trends, spot opportunities, and measure the effectiveness of marketing efforts.
For example, an e-commerce business could use Power BI to create a marketing dashboard that tracks key performance indicators (KPIs) like website traffic, conversion rates, average order value, and customer acquisition cost. By visualizing this data in an interactive dashboard, the marketing team can quickly identify areas for improvement, such as optimizing product pages for higher conversion rates or adjusting advertising campaigns to reduce customer acquisition cost. A local business might track foot traffic correlated with local events, weather, and advertising campaigns.
Power BI offers several compelling features specifically beneficial for marketing teams:
- AI-powered analytics and natural language query: Ask questions in plain English, such as “What were my top performing campaigns last quarter?” and receive instant data-driven answers. This feature democratizes data access, making it easier for non-technical users to glean insights.
- Custom visualization development: Tailor dashboards to your specific needs with a wide range of visualization options, from standard charts and graphs to more advanced visuals like heatmaps and treemaps.
- Seamless integration with the Microsoft ecosystem: Leverage existing investments in Microsoft products like Excel, Dynamics 365, and Azure for streamlined data integration and analysis. This is particularly advantageous for businesses already heavily reliant on the Microsoft ecosystem.
- Powerful DAX (Data Analysis Expressions) formula language: Perform complex calculations and data manipulations to derive deeper insights from your marketing data.
Pricing and Technical Requirements: Power BI offers a tiered pricing model, including a free Desktop version for individual users and Pro and Premium versions for businesses requiring collaboration and advanced features. The technical requirements are relatively modest, primarily needing sufficient computing resources and a stable internet connection for cloud-based deployments. On-premise deployments require server infrastructure.
Comparison with Similar Tools: Compared to tools like Tableau and Google Data Studio, Power BI offers a more cost-effective entry point, especially for smaller businesses. While Tableau might be more powerful for complex data visualizations, Power BI’s integration with the Microsoft ecosystem and its user-friendly interface make it a strong contender.
Implementation/Setup Tips:
- Start with a clear objective: Define the key metrics you want to track and the insights you hope to gain.
- Connect to relevant data sources: Ensure access to all necessary data, whether it resides in spreadsheets, databases, or marketing platforms.
- Utilize pre-built templates: Power BI offers a library of pre-built templates to jumpstart dashboard creation.
- Experiment with different visualizations: Explore various chart types and visual representations to find the most effective way to communicate your data.
Pros:
- Cost-effective compared to many enterprise BI solutions
- Familiar interface for users of Microsoft products
- Regular monthly updates with new features
- Strong security and governance capabilities
Cons:
- More complex data modeling compared to some competitors
- Some advanced features only available in Premium tier
- Mobile experience not as robust as desktop version
- Can become resource-intensive with large datasets
Website: powerbi.microsoft.com
7. HubSpot Marketing Analytics
HubSpot Marketing Analytics offers a robust suite of marketing dashboards integrated within its broader marketing platform. This provides a centralized view of your marketing performance, consolidating data from various campaigns, content pieces, and channels. Unlike standalone dashboarding tools, HubSpot’s deep integration with its marketing automation features allows for closed-loop reporting, tracking the entire customer journey from initial contact to final conversion. This makes it a particularly valuable marketing dashboard example for inbound marketing teams focused on content performance, lead generation, and nurturing campaigns.
For SMEs and startups looking to scale their digital presence, HubSpot’s all-in-one approach simplifies marketing analytics. Imagine tracking blog post performance, identifying high-converting landing pages, and monitoring social media engagement all within a single dashboard. This streamlined approach eliminates the need to juggle multiple tools, saving valuable time and resources. For larger corporate marketing teams, the built-in attribution modeling helps pinpoint which marketing activities are driving the most revenue, enabling data-driven budget allocation and strategy optimization. E-commerce businesses benefit from tracking website traffic, conversion rates, and customer behavior, allowing them to refine their online strategies and boost sales. Whether you’re a local business or an international corporation, HubSpot’s dashboards provide actionable insights to drive growth.
Key Features:
- Closed-loop Marketing Analytics: Connect marketing and sales activities to understand the full customer lifecycle.
- Campaign Performance Dashboards: Track campaign effectiveness with built-in attribution modeling.
- Content Performance Analytics: Analyze the performance of your blog posts, emails, landing pages, and other content assets.
- Custom Report Builder: Create bespoke reports with a user-friendly drag-and-drop interface.
- Automated Reporting: Schedule reports to be delivered automatically via email.
Pros:
- Seamless Integration: Works flawlessly with other HubSpot tools, creating a cohesive marketing ecosystem.
- Simplified Tracking: No need for third-party integrations to track your core marketing activities.
- User-Friendly Interface: Easy to navigate and requires minimal training.
- Built-in Attribution Modeling: Understand which marketing efforts are contributing most to conversions.
Cons:
- HubSpot Ecosystem Dependence: Limited functionality if you’re not using other HubSpot products.
- External Data Integration Challenges: Less flexible for connecting external data sources.
- Tiered Pricing: Advanced analytics features are often locked behind higher-priced tiers.
- Not Ideal for Diverse Tech Stacks: May not be suitable for organizations relying on a variety of disparate marketing technologies.
Implementation Tips:
- Define Key Performance Indicators (KPIs): Before setting up your dashboards, identify the metrics that matter most to your business objectives.
- Utilize Pre-built Templates: HubSpot offers a range of pre-built dashboard templates to get you started quickly.
- Customize Your Dashboards: Tailor the dashboards to your specific needs by adding or removing reports and widgets.
- Regularly Review and Analyze: Make it a habit to review your dashboards regularly and analyze the data to identify trends and opportunities.
Pricing: HubSpot Marketing Hub offers tiered pricing based on features and contacts. Marketing analytics dashboards are included in all paid tiers, with more advanced features available in higher tiers. Visit the HubSpot website for detailed pricing information.
Technical Requirements: HubSpot is a cloud-based platform, so there are no specific hardware or software requirements beyond a stable internet connection and a web browser.
Comparison with Similar Tools: While tools like Google Analytics provide a free option for basic web analytics, HubSpot’s integrated platform offers a more comprehensive view of the entire marketing funnel, particularly for businesses invested in inbound marketing. Other marketing automation platforms like Marketo and Pardot offer similar analytics capabilities but often come at a higher price point.
HubSpot Marketing Analytics earns its place on this list of marketing dashboard examples because of its integrated approach, user-friendly interface, and robust features. Its closed-loop reporting capabilities and built-in attribution modeling make it a powerful tool for understanding the full impact of your marketing efforts, ultimately driving better decision-making and ROI.
8. Klipfolio
Klipfolio is a powerful cloud-based business dashboard platform that’s particularly well-suited for marketing teams needing real-time data visualization. Its strength lies in its ability to connect to a vast network of over 300 services, allowing marketers to consolidate key metrics from diverse channels into custom dashboards. This makes Klipfolio a valuable tool for building comprehensive marketing dashboard examples, enabling businesses to monitor everything from social media engagement and PPC campaign performance to email marketing metrics, all within a unified view. This centralized approach streamlines data analysis and facilitates quicker, more informed decision-making. For SMEs and startups looking to scale their digital presence, or for corporate marketing teams needing data-driven insights, Klipfolio offers the flexibility to create bespoke dashboards tailored to specific business needs.
Klipfolio stands out for its highly customizable dashboard design capabilities. The platform’s Klip Editor allows users to build custom metrics and calculations using formulas, enabling a granular level of data analysis. This feature is particularly beneficial for e-commerce businesses needing to track specific product performance or website conversion rates. Furthermore, Klipfolio’s real-time data refresh ensures that dashboards are always up-to-date, enabling teams to react swiftly to changing market conditions and campaign performance.
Features:
- 300+ pre-built connectors: Integrate with various marketing data sources like Google Analytics, Facebook Ads, Mailchimp, and more.
- Klip Editor: Create custom metrics and calculations using formulas.
- Real-time data refresh and monitoring: Stay informed about the latest data changes.
- Flexible dashboard layouts: Design dashboards with various visualization options like charts, graphs, and tables.
- Client dashboard sharing and white-labeling options: Share dashboards with clients or create branded reports. This is a valuable feature for agencies managing multiple client accounts.
Pros:
- Highly flexible for creating custom metrics and calculations: Tailor dashboards to specific business requirements.
- Strong API capabilities for advanced data integration: Connect with virtually any data source.
- Excellent white-labeling options for agencies: Present data under your brand.
- Competitive pricing compared to enterprise solutions: Offers a good balance of features and affordability.
Cons:
- Steeper learning curve for building complex dashboards: Requires some technical knowledge to utilize the Klip Editor effectively.
- User interface feels less modern than some competitors: Could benefit from a design refresh.
- Building custom metrics requires some technical knowledge: Not as intuitive for non-technical users.
- Mobile experience not as robust as desktop: Limited functionality on mobile devices.
Pricing: Klipfolio offers tiered pricing plans based on the number of users and data sources. Details can be found on their website.
Implementation Tips:
- Start with a clear understanding of your key marketing metrics.
- Utilize the pre-built connectors for common data sources.
- Explore the Klip Editor for creating custom calculations and metrics.
- Experiment with different dashboard layouts and visualizations.
- Leverage Klipfolio’s extensive documentation and support resources.
Klipfolio earns its place in this list of marketing dashboard examples due to its powerful customization options, real-time data updates, and extensive integrations. While it has a slight learning curve, the flexibility and depth of analysis it offers make it a valuable tool for businesses of all sizes seeking data-driven insights to optimize their marketing efforts.
Marketing Dashboard Tools Comparison
| Tool | Core Features ✨ | User Experience ★ | Value Proposition 💰 | Target Audience 👥 | Unique Selling Points 🏆 |
|---|---|---|---|---|---|
| Tableau | Drag-drop viz, real-time multi-source data | ★★★★☆ Steep learning curve | 💰 Premium pricing, enterprise-grade | Large enterprises, data teams | Advanced AI insights, robust security |
| Google Data Studio | Native Google integration, customizable dash | ★★★★☆ User-friendly, free platform | 💰 Free, excellent Google ecosystem | Small to medium businesses | Unlimited reports, seamless Google tools |
| Databox | 500+ templates, goal tracking, alerts | ★★★★☆ Intuitive, mobile app | 💰 Affordable tiers for teams | Agencies, marketing teams | Automated scorecards, strong alert system |
| Looker (Google Cloud) | LookML modeling, embedded analytics | ★★★☆☆ Requires technical expertise | 💰 High price, enterprise focus | Large orgs with complex data | Consistent metrics, deep GCP integration |
| Domo | 1,000+ connectors, ETL, card-based viz | ★★★☆☆ Mobile-first, collaborative | 💰 Premium pricing | Enterprises with large data sets | Massive data handling, social collaboration |
| Power BI | AI analytics, Microsoft ecosystem integration | ★★★★☆ Familiar MS interface, updates | 💰 Cost-effective vs enterprise BI | MS users, mid to large teams | Strong DAX formulas, cloud & on-prem options |
| HubSpot Marketing Analytics | Closed-loop marketing, campaign attribution | ★★★★☆ User-friendly, integrated | 💰 Tied to HubSpot platform | Inbound marketing teams | Built-in attribution, seamless marketing suite |
| Klipfolio | 300+ connectors, real-time refresh, flexible | ★★★☆☆ Technical for complex dashboards | 💰 Competitive pricing, agency-friendly | Agencies, data-savvy marketers | White-labeling, strong API & custom calc support |
Transform Your Marketing with Data-Driven Decisions
These eight marketing dashboard examples—Tableau, Google Data Studio, Databox, Looker (Google Cloud), Domo, Power BI, HubSpot Marketing Analytics, and Klipfolio—offer a glimpse into the transformative power of data visualization. From visualizing website traffic and conversion rates to tracking social media engagement and campaign ROI, the right dashboard empowers you to understand your marketing performance at a glance. Key takeaways include the importance of selecting a tool that aligns with your budget and technical expertise, the necessity of clearly defined KPIs, and the potential for real-time insights to drive strategic adjustments.
Building a marketing dashboard is just the first step. To get the most from your dashboards, it’s crucial to define what success looks like. For a data-driven approach to measuring your marketing efforts, explore this guide on how to measure marketing success from Big Moves Marketing. When implementing your chosen tool, prioritize data accuracy, user-friendliness, and integration with existing systems. Remember to consider factors like the size of your team, the complexity of your data, and your specific reporting needs when selecting the perfect platform for your business.
Don’t just collect data; let it fuel your growth. Empower your decision-making with the right insights and watch your marketing strategies flourish. Need help navigating the world of marketing dashboards and data-driven strategies? Well Web Marketing specializes in helping businesses like yours choose and implement the ideal marketing dashboard solutions, turning data into actionable insights. Contact us today to unlock the full potential of your marketing data.