7 Marketing KPI Examples to Track in 2025
Unlocking Marketing Success with KPIs
This listicle provides marketing KPI examples to measure and improve your marketing effectiveness. Learn how to track key metrics like website traffic, conversion rate, customer acquisition cost (CAC), return on marketing investment (ROMI), email marketing performance, social media engagement, and Net Promoter Score (NPS). Understanding these KPIs is crucial for data-driven decisions, optimized campaigns, and achieving your business objectives. This list will help you identify the right KPIs for your needs and boost your marketing ROI in 2025.
1. Website Traffic
Website traffic is a foundational marketing KPI that measures the number of users visiting your website over a specific period. It serves as a barometer for the effectiveness of your overall online marketing strategy, encompassing efforts like SEO, content marketing, social media campaigns, and paid advertising. Tracking website traffic allows you to gauge the reach of your marketing initiatives and understand how well they are driving potential customers to your online presence. This KPI is crucial for businesses of all sizes, from startups seeking an initial foothold to established enterprises aiming to expand their market share.

Features and Benefits:
Website traffic data offers granular insights, allowing segmentation by various factors. You can analyze traffic based on its source (organic, direct, referral, social, paid), providing a clear picture of which channels are performing best. This data is typically measured daily, weekly, or monthly and often visualized as trend lines to identify patterns and growth trajectories. Further segmentation by new vs. returning visitors helps you understand audience engagement and loyalty. One of the key benefits of tracking website traffic is its ability to serve as a leading indicator for sales and conversions. By monitoring traffic trends, you can anticipate potential increases or decreases in business activity.
Pros:
- High-Level View of Reach: Provides a broad overview of how many people your marketing efforts are reaching.
- Easy Measurement: Simple to track using widely available website analytics tools.
- Campaign Effectiveness: Offers clear data on the success of specific marketing campaigns.
- Leading Sales Indicator: Helps predict potential changes in sales and conversions.
Cons:
- Quality over Quantity: High traffic volume doesn’t guarantee qualified leads or conversions.
- Seasonal Fluctuations: Traffic can vary based on seasonality, requiring careful interpretation.
- Indirect Revenue Tie: Doesn’t directly correlate to revenue generation, requiring analysis in conjunction with other KPIs.
- Bot Traffic Inflation: Can be artificially inflated by non-human bot traffic, skewing results.
Examples of Successful Implementation:
Several companies have demonstrated the power of focusing on website traffic as a key performance indicator:
- HubSpot: Increased website traffic by 75% through content marketing optimization, demonstrating the effectiveness of a content-driven strategy.
- Shopify: Saw a 30% increase in organic traffic after implementing a comprehensive SEO strategy, highlighting the importance of organic search visibility.
- Buffer: Grew website visits by 50% through strategic social media content distribution, showcasing the potential of social media for driving traffic.
Actionable Tips:
- UTM Parameters: Implement UTM parameters to precisely track the origin of your website traffic, enabling accurate attribution of marketing efforts.
- Behavior Analysis: Analyze traffic patterns alongside user behavior metrics (bounce rate, time on page, etc.) for a holistic understanding of website performance. Driving traffic to your website is just the first step. Understanding user behavior and website performance is critical for optimizing your marketing efforts. By leveraging website analytics tools, you can gain insights into how users interact with your site, identify areas for improvement, and track key metrics like bounce rate and time on page.
- Segmentation: Segment traffic by device, location, and demographic data to identify key audience segments and tailor your marketing accordingly.
- Benchmarking: Compare your website traffic against industry benchmarks to gauge your performance relative to competitors and identify areas for improvement.
Website traffic deserves its place in any marketing KPI list as a fundamental metric reflecting the effectiveness of your online presence and marketing campaigns. By carefully monitoring, analyzing, and optimizing for website traffic, businesses can lay the groundwork for increased brand visibility, lead generation, and ultimately, revenue growth. This KPI is especially relevant for SMEs, startups, corporate marketing teams, e-commerce businesses, and any company seeking a strong digital presence, providing valuable insights for data-driven decision-making and strategic growth.
2. Conversion Rate
Conversion Rate is a crucial marketing KPI that measures the percentage of website visitors who complete a desired action. This “desired action” could be anything from making a purchase and signing up for a newsletter to filling out a contact form or downloading a resource. It’s calculated by dividing the number of conversions by the total number of visitors and multiplying by 100. Tracking conversion rate is essential for understanding how effectively your marketing efforts are translating into tangible business outcomes. It provides a clear picture of how well your website and marketing campaigns are driving desired user behavior.

Conversion rate deserves a prominent place in any marketing KPI dashboard because it directly connects marketing activities to business goals. Whether you’re an e-commerce business aiming for sales, a SaaS startup driving sign-ups, or a local business generating leads, conversion rate provides a quantifiable measure of success. Its versatility allows you to track progress towards various objectives, making it a powerful tool for data-driven decision-making.
Features and Benefits:
- Measurable across diverse goals: Track conversions for sales, leads, registrations, downloads, and more.
- Segmentable for granular analysis: Analyze conversion rates by traffic source (e.g., organic, paid), landing page, campaign, or specific user segments.
- Journey-focused insights: Understand how conversion rates change across different stages of the user journey, from initial awareness to final purchase.
- Micro and Macro Conversions: Differentiate between smaller steps (micro-conversions, like adding an item to cart) and primary goals (macro-conversions, like completing a purchase) to identify areas for improvement.
Pros:
- Directly tied to business outcomes: Provides a clear measure of marketing effectiveness in driving desired results.
- Identifies high-performing channels and campaigns: Pinpoints which marketing activities are generating the most conversions, enabling optimized resource allocation.
- Facilitates ROI calculations: Allows for precise measurement of the return on investment for various marketing initiatives.
- Highlights website optimization opportunities: Reveals areas where website improvements can lead to increased conversions.
Cons:
- External factors: Website performance issues, external economic conditions, and other factors outside of marketing’s control can influence conversion rates.
- Industry benchmarks vary: Comparing conversion rates across different industries can be misleading due to varying benchmarks.
- Incomplete picture of customer journey: May not capture the full customer journey, particularly in complex sales cycles involving multiple touchpoints.
- Attribution challenges: Accurate attribution can be difficult in multi-touch scenarios where users interact with multiple marketing channels before converting.
Examples of Successful Implementation:
- Unbounce improved landing page conversion rates by 30% through A/B testing.
- Airbnb increased booking conversions by 25% after redesigning their search results page.
- Casper achieved a 5% increase in checkout conversions by simplifying their payment process.
Actionable Tips for SMEs and Startups:
- Set up robust tracking and attribution models: Utilize analytics platforms like Google Analytics to accurately track conversions and attribute them to specific marketing channels.
- Implement A/B testing for conversion optimization: Experiment with different variations of landing pages, calls to action, and other website elements to identify what resonates best with your audience.
- Analyze user behavior: Use heat maps and session recordings to understand how users interact with your website and identify potential roadblocks to conversion.
- Prioritize page speed and UX improvements: A fast-loading and user-friendly website is crucial for maximizing conversion rates.
- Optimize for mobile conversions separately: Ensure your website is mobile-responsive and provides a seamless experience for users on all devices.
Popularized By: CXL Institute, Optimizely, Conversion XL, Neil Patel
By focusing on conversion rate optimization, businesses can improve their marketing ROI, enhance website performance, and ultimately drive more revenue. This KPI is a vital metric for any organization seeking to succeed in the digital landscape.
3. Customer Acquisition Cost (CAC)
Customer Acquisition Cost (CAC) is a crucial marketing KPI example that every business, especially SMEs, startups, and e-commerce ventures striving for digital growth, should track. It measures the total cost a business incurs to acquire a new customer. This includes all marketing and sales expenses, from advertising campaigns and content creation to sales team salaries and CRM software costs. Understanding your CAC is fundamental for evaluating marketing efficiency, optimizing budget allocation, and ultimately, driving sustainable growth. This metric deserves its place on this list because it provides a clear, quantifiable way to assess the effectiveness of your marketing efforts and make data-driven decisions.
How it Works:
CAC is calculated by dividing the total acquisition expenses by the number of new customers acquired within a specific period, typically a month or a quarter. For example, if you spent $10,000 on marketing and sales in a month and acquired 100 new customers, your CAC would be $100.
Features and Benefits:
- Comprehensive Cost Analysis: CAC accounts for all expenses related to customer acquisition, offering a holistic view of your spending.
- Granular Insights: You can calculate CAC per channel (e.g., social media, paid search), campaign, or even product line, enabling precise budget optimization.
- Strategic Decision-Making: Analyzing CAC alongside Customer Lifetime Value (CLTV) allows you to determine the long-term profitability of your customer acquisition strategies.
- Performance Benchmarking: Comparing your CAC to industry benchmarks provides valuable context and identifies areas for improvement.
Pros:
- Provides a clear picture of marketing ROI and efficiency.
- Enables data-driven budget optimization across different channels.
- Helps determine sustainable growth rates by identifying cost-effective acquisition strategies.
- Facilitates comparison between different acquisition strategies and campaigns.
Cons:
- Requires accurate attribution of costs to specific customers, which can be challenging.
- May not fully account for brand building activities that contribute to long-term customer acquisition.
- Can be difficult to calculate in complex multi-channel environments with overlapping touchpoints.
- Might not immediately reflect the long-term value of acquisition efforts, particularly for businesses with high CLTV.
Examples of Successful Implementation:
- Dropbox: Implemented a referral program that significantly reduced their CAC by incentivizing existing customers to bring in new users.
- Slack: Focused on word-of-mouth marketing and organic growth through community building, resulting in lower acquisition costs compared to traditional advertising.
- Zoom: Leveraged a freemium model to acquire a large user base at a low CAC, relying on organic growth and upselling to paid plans.
Actionable Tips for SMEs and Startups:
- Channel-Specific CAC: Calculate CAC for each marketing channel to identify your most cost-effective acquisition sources.
- Benchmarking: Compare your CAC to industry averages and competitors to assess your performance and identify areas for optimization.
- CAC/LTV Ratio: Analyze your CAC/LTV ratio. A ratio of 3:1 or better is generally considered healthy, indicating that the value generated by a customer outweighs the cost of acquiring them.
- Regular Audits: Regularly audit the expenses included in your CAC calculations to ensure accuracy and identify potential cost savings.
- Payback Period: Consider the payback period – the time it takes for a customer to generate revenue equal to their acquisition cost – alongside your CAC.
When and Why to Use This Approach:
CAC should be a core metric for any business investing in marketing and sales. It is particularly valuable for:
- SMEs and Startups: Limited budgets necessitate a laser focus on efficient customer acquisition.
- E-commerce Businesses: High website traffic and online advertising require careful tracking of CAC to optimize campaign performance.
- Corporate Marketing Teams: Data-driven decision-making requires quantifiable metrics like CAC to justify marketing spend and demonstrate ROI.
By diligently tracking and analyzing CAC, businesses can make informed decisions about their marketing investments, optimize their strategies, and achieve sustainable, profitable growth. Popularized by industry leaders like David Skok, SaaS Capital, Andrew Chen, and HubSpot, CAC is a cornerstone of modern marketing analytics.
4. Return on Marketing Investment (ROMI)
Return on Marketing Investment (ROMI) is a crucial marketing KPI example for any business, especially SMEs, startups, and e-commerce ventures striving for growth in the digital landscape. It measures the effectiveness of your marketing spend by calculating the revenue generated for every dollar invested. Understanding ROMI empowers data-driven decisions, justifies budget allocation, and demonstrates the value of marketing activities to stakeholders. This makes it a deserving addition to any list of essential marketing KPIs.
How it Works:
ROMI is calculated using the following formula:
(Revenue Attributed to Marketing – Marketing Investment) / Marketing Investment
The result is expressed as a percentage or ratio. For example, a ROMI of 5:1 signifies that for every $1 spent on marketing, $5 in revenue is generated. A percentage ROMI of 500% signifies the same return.
Features and Benefits:
ROMI focuses specifically on marketing activities, unlike general ROI, which encompasses all business operations. It allows you to analyze the profitability of specific campaigns or assess the overall performance of your marketing efforts. This granularity allows for optimized budget allocation and strategic decision-making. The calculation can encompass both direct and indirect revenue attribution, providing a holistic view of marketing impact. Furthermore, ROMI can be calculated for different timeframes, allowing you to analyze both short-term and long-term returns, which is especially important for businesses with seasonal cycles.
Pros:
- Directly connects marketing expenditure to financial returns: This provides clear visibility into the effectiveness of your marketing strategies.
- Justifies marketing budgets to executives: Demonstrating a positive ROMI strengthens your case for increased marketing investment.
- Enables comparison between different marketing initiatives: Identify high-performing campaigns and optimize underperforming ones.
- Supports data-driven budget allocation decisions: Allocate resources to the most profitable marketing channels and activities.
Cons:
- Attribution can be challenging: Accurately attributing revenue to specific marketing efforts can be complex, particularly for brand-building activities with delayed returns.
- May not account for long-term brand equity building: ROMI primarily focuses on short-term financial returns and might undervalue long-term brand building initiatives.
- Different calculation methodologies make benchmarking difficult: Comparing ROMI across different companies or industries can be misleading due to variations in calculation methods.
- Can be skewed by marketing efforts with delayed returns: Campaigns focused on long-term brand building might appear to have a lower ROMI initially.
Examples of Successful Implementation:
- Coca-Cola: Uses ROMI to evaluate the effectiveness of major advertising campaigns across different markets, allowing them to optimize ad spend and maximize returns.
- Procter & Gamble (P&G): Implemented ROMI calculations that led to significant improvements in marketing efficiency, resulting in substantial cost savings.
- IBM: IBM’s marketing team leveraged AI-powered campaign optimization to significantly increase their ROMI.
Actionable Tips for SMEs and Startups:
- Establish clear attribution models: Define how you will attribute revenue to specific marketing activities before calculating ROMI. Consider using tools like Google Analytics to track conversions and attribute them to different channels.
- Include all relevant costs: Factor in all marketing expenses, including creative development, technology costs, and staff time, to get an accurate ROMI calculation.
- Set ROMI targets based on business objectives and industry standards: Research typical ROMI benchmarks for your industry and set realistic, achievable targets.
- Consider time-period adjustments for seasonal businesses: Account for seasonality when analyzing ROMI and compare performance year-over-year for a more accurate assessment.
- Supplement with non-financial KPIs: While ROMI is critical, it’s essential to consider other metrics, such as brand awareness, customer engagement, and website traffic, for a comprehensive evaluation of your marketing performance.
By effectively utilizing ROMI as a key performance indicator, businesses of all sizes, from startups to established enterprises, can gain valuable insights into the effectiveness of their marketing investments and drive sustainable growth in the competitive digital landscape.
5. Email Marketing Performance
Email marketing remains a cornerstone of successful digital marketing strategies, offering a direct line of communication with your audience and driving tangible results. As a key performance indicator (KPI), email marketing performance provides valuable insights into the effectiveness of your campaigns and guides optimization efforts. This KPI encompasses a range of metrics that, when analyzed together, paint a comprehensive picture of your email marketing success. It’s crucial for SMEs, startups, corporate marketing teams, e-commerce businesses, and indeed any company looking to leverage the power of digital communication.

This KPI tracks how your audience interacts with your email campaigns, measuring everything from initial opens to final conversions. Key metrics include open rate (the percentage of recipients who open your email), click-through rate (the percentage who click on a link within the email), bounce rate (the percentage of emails that were not delivered), and unsubscribe rate (the percentage of recipients who opted out of your mailing list). By analyzing these metrics, you can identify areas for improvement in your email strategy, content, and segmentation. This KPI deserves its place on this list due to its direct impact on revenue generation and customer engagement, making it a vital metric for any business investing in digital marketing.
Features and Benefits:
- Granular Segmentation: Segment your analysis by campaign type, audience segment, or time period for targeted insights.
- Revenue Correlation: Directly correlate email campaigns with revenue generated to understand their impact on your bottom line.
- Benchmarking: Compare your performance against industry benchmarks to identify areas for growth and gauge your competitiveness.
- Personalized Testing: Facilitates A/B testing of different email elements for continuous optimization.
Pros:
- Real-time Feedback: Quickly assess campaign effectiveness and make necessary adjustments.
- High ROI: Email marketing consistently delivers a strong return on investment compared to other marketing channels.
- Personalization: Enables tailored messaging and targeted offers for improved engagement.
- Direct Attribution: Track conversions and attribute revenue directly to specific email campaigns.
Cons:
- Open Rate Fluctuations: Open rates can be affected by email client settings and pre-fetching practices.
- Inbox Competition: Declining organic reach necessitates ongoing efforts to stand out in crowded inboxes.
- Privacy Concerns: Evolving privacy regulations can impact tracking capabilities.
- Content Demands: Requires consistent content creation and list maintenance for optimal performance.
Examples of Successful Implementation:
- Grammarly: Achieved a 50% open rate by personalizing subject lines and content to resonate with individual users.
- Dollar Shave Club: Maintains 40%+ open rates with concise, value-driven emails that cut through the noise.
- Airbnb: Increased booking conversions by 10% through behavior-triggered emails sent at opportune moments in the customer journey.
Actionable Tips for SMEs and Startups:
- Segmentation: Divide your email list based on user behavior, demographics, and preferences for targeted campaigns.
- A/B Testing: Experiment with subject lines, send times, and content formats to optimize open and click-through rates.
- List Hygiene: Regularly clean your email list to remove inactive or invalid addresses, improving deliverability.
- Automation: Implement automated workflows for welcome emails, abandoned cart reminders, and re-engagement sequences.
- Mobile Optimization: Ensure your email templates are responsive and display correctly on all devices.
When and Why to Use This Approach:
Email marketing performance should be a continuous focus for any business leveraging email communication. Tracking these KPIs is essential for understanding what resonates with your audience, maximizing your ROI, and achieving your marketing objectives. By regularly analyzing these metrics and implementing the tips provided, you can ensure your email marketing efforts contribute significantly to your overall business growth. This approach is particularly valuable for e-commerce businesses seeking to drive sales, startups building brand awareness, and SMEs fostering customer loyalty. Popularized by industry leaders like Mailchimp, Campaign Monitor, Emma, Litmus, and thought leaders like Seth Godin, email marketing remains a powerful tool when utilized effectively.
6. Social Media Engagement Rate
Social Media Engagement Rate is a crucial marketing KPI example that measures how actively users interact with your content on various social media platforms. It provides valuable insights into your content’s effectiveness and audience interest, going beyond vanity metrics like follower count to paint a clearer picture of your social media performance. It’s calculated by dividing the total number of engagements (likes, comments, shares, saves, clicks) by the total number of followers or impressions, then multiplying by 100 to express it as a percentage. This allows you to understand what percentage of your audience is actively engaging with your content.
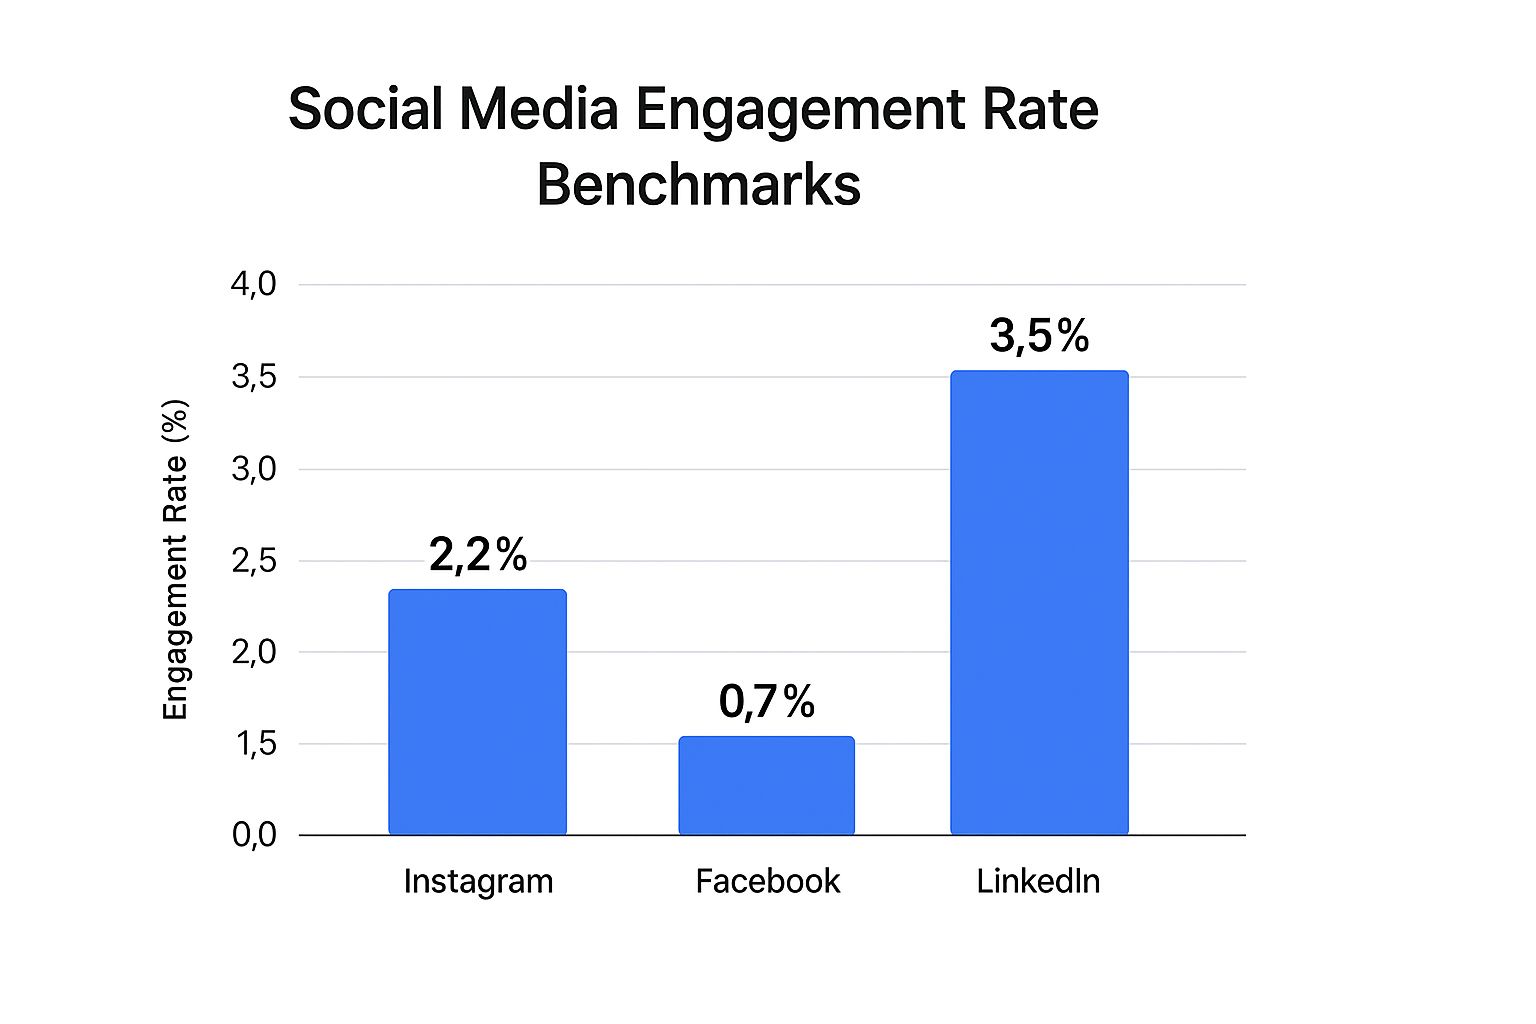
The infographic above visually represents average engagement rates across different social media platforms. As the chart shows, Instagram and Facebook generally yield higher engagement rates compared to Twitter and LinkedIn. This data underscores the importance of tailoring your content strategy to each platform’s unique user behavior. For instance, visually-driven content might perform better on Instagram, while thought leadership pieces might resonate more with the LinkedIn audience.
This KPI deserves a place on this list because it provides a tangible way to measure the effectiveness of your social media strategy. Features like cross-platform measurement (Instagram, Facebook, Twitter, LinkedIn) and the inclusion of various interaction types (likes, comments, shares, clicks, saves) allow for a comprehensive understanding of audience behavior. This data can then be used to optimize future content and campaigns. You can calculate engagement rates per post, per campaign, or as account averages, offering flexibility in analysis. It’s also possible to weight certain interactions (e.g., shares over likes) to prioritize actions aligning with your specific goals.
Pros:
- Indicates Content Relevance and Audience Interest: High engagement suggests your content resonates with your target audience.
- Helps Identify High-Performing Content Types: Track which types of content (videos, images, text posts) generate the most engagement.
- Contributes to Algorithmic Reach and Visibility: Higher engagement signals to platform algorithms that your content is valuable, leading to increased organic reach.
- More Meaningful than Follower Count: Engagement reveals active interest, unlike follower count, which can be misleading.
Cons:
- Engagement Definitions Vary Across Platforms: Each platform calculates engagement differently, making direct comparisons challenging.
- Can be Artificially Inflated: Engagement can be manipulated through bots or engagement pods, skewing results.
- Not Directly Tied to Business Outcomes: While engagement is important, it doesn’t always directly translate to sales or conversions.
- Benchmark Rates Vary Significantly: Industry and platform benchmarks differ, making it crucial to compare your performance against relevant competitors.
Examples of Successful Implementation:
- GoPro: Maintains 4-5% engagement rates by leveraging user-generated action content, creating a sense of community.
- Glossier: Achieves 3.5%+ engagement through authentic, community-focused content that fosters genuine interaction.
- National Geographic: Receives exceptionally high engagement through compelling visual storytelling that captivates audiences.
Tips for SMEs, Startups, and Corporate Teams:
- Calculate Platform-Specific Engagement Rates: Use the correct formulas for each platform to get accurate data.
- Track Engagement Rate Trends: Monitor engagement over time to identify patterns and assess the impact of your strategies.
- Analyze Content Performance: Determine which topics and formats drive the highest engagement.
- Respond to Comments: Boost engagement and algorithm visibility by actively participating in conversations.
- Focus on Share-Worthy Content: Create content that encourages deeper interaction and organic sharing.
Popularized By: Hootsuite, Sprout Social, Buffer, Gary Vaynerchuk, Later
Social Media Engagement Rate is a valuable marketing KPI example, particularly for businesses aiming to build a strong online presence and understand their audience. By tracking and analyzing engagement metrics, you can refine your social media strategy, improve content effectiveness, and ultimately drive better results.
7. Net Promoter Score (NPS)
Net Promoter Score (NPS) is a crucial marketing KPI example for businesses of all sizes, from ambitious startups to established corporations, seeking to gauge customer loyalty and satisfaction. It’s a simple yet powerful metric that measures how likely your customers are to recommend your company to others, providing valuable insights into customer experience and potential for growth. This makes it a highly relevant metric for those looking for marketing KPI examples to fuel their digital growth strategies.
NPS works by asking customers a single question: “On a scale of 0 to 10, how likely are you to recommend [your company/product/service] to a friend or colleague?” Based on their responses, customers are categorized into three groups:
- Detractors (0-6): Unhappy customers who may churn and even damage your brand through negative word-of-mouth.
- Passives (7-8): Satisfied but not enthusiastic customers who are vulnerable to competitive offerings.
- Promoters (9-10): Loyal and enthusiastic customers who are likely to recommend your brand and drive growth.
Your NPS is then calculated by subtracting the percentage of Detractors from the percentage of Promoters, resulting in a score ranging from -100 (all detractors) to +100 (all promoters).
Why NPS Deserves a Place in Your Marketing KPI Arsenal:
NPS earns its spot as a top marketing KPI example due to its simplicity, strong correlation with business growth, and ability to provide valuable qualitative feedback. It offers a concise overview of customer sentiment, enabling you to identify areas for improvement and track the impact of your marketing efforts. For SMEs and startups, NPS can be particularly valuable in understanding early customer perceptions and refining their offerings. Larger corporations can utilize NPS to benchmark against competitors and identify best practices.
Features and Benefits of Using NPS:
- Single question survey: Easy to administer and doesn’t require significant time from your customers.
- Follow-up for qualitative feedback: Asking “Why did you give this score?” provides valuable insights into customer experiences.
- Segmentation: Analyze NPS by customer type, product, or touchpoint to pinpoint specific areas for improvement.
- Trend tracking: Monitor NPS over time to understand the impact of marketing campaigns and operational changes.
- Benchmarking: Compare your NPS against industry averages to identify areas where you excel or need to catch up.
Pros:
- Simple to implement and understand.
- Correlates with business growth and customer retention.
- Facilitates benchmarking against competitors.
- Combines quantitative scoring with qualitative feedback.
Cons:
- Doesn’t always explain the full “why” behind customer scores.
- Cultural differences can influence scoring tendencies.
- Can oversimplify complex customer relationships.
- Not directly tied to specific marketing activities.
Examples of Successful NPS Implementation:
- Apple consistently maintains NPS scores above 70, demonstrating strong customer loyalty.
- USAA financial services achieves industry-leading NPS of 75+, reflecting their commitment to customer service.
- Tesla leverages a remarkably high NPS (around 96) to drive word-of-mouth marketing and brand advocacy.
Actionable Tips for Using NPS Effectively:
- Ask “Why?”: Always follow up NPS surveys with an open-ended question to understand the reasons behind the score.
- Close the Loop: Address detractor feedback and actively work to resolve customer issues.
- Segment for Insights: Break down NPS by different customer segments and touchpoints to identify specific problem areas.
- Track Trends: Focus on NPS trends over time rather than fixating on absolute numbers.
- Consider Different NPS Types: Distinguish between relationship NPS (overall satisfaction) and transactional NPS (specific interactions).
Popularized By: Fred Reichheld, Bain & Company, Satmetrix, Qualtrics
By incorporating NPS into your marketing KPI framework, you can gain a valuable understanding of customer loyalty, identify areas for improvement, and ultimately drive sustainable business growth. This makes NPS an essential tool for any business aiming to enhance its online presence and achieve its marketing objectives.
7 Key Marketing KPI Comparison
| KPI | Implementation Complexity 🔄 | Resource Requirements ⚡ | Expected Outcomes 📊 | Ideal Use Cases 💡 | Key Advantages ⭐ |
|---|---|---|---|---|---|
| Website Traffic | Low – easy setup with analytics tools | Low – requires web analytics platform | High-level insights into reach and campaign effectiveness | Monitoring marketing reach and channel performance | Clear campaign effectiveness indicator; easy to measure |
| Conversion Rate | Medium – requires proper tracking and setup | Medium – needs analytics and testing tools | Direct link to business outcomes; identifies optimization opportunities | Optimizing funnels, improving sales and lead generation | Ties marketing to revenue; supports ROI calculations |
| Customer Acquisition Cost (CAC) | Medium-High – needs accurate cost attribution | Medium-High – data collection across channels | Measures marketing efficiency and budget optimization | Budgeting and channel strategy evaluation | Enables efficient budget allocation; compares acquisition strategies |
| Return on Marketing Investment (ROMI) | High – complex attribution models | High – requires detailed cost and revenue data | Direct financial return measurement on marketing spend | Justifying marketing budgets; evaluating campaign profitability | Connects spend to revenue; supports data-driven decisions |
| Email Marketing Performance | Medium – tracking multiple email metrics | Medium – email platform and content creation | Immediate, actionable feedback; high ROI potential | Email campaign optimization and segmentation | Detailed personalization; direct revenue attribution |
| Social Media Engagement Rate | Low – platform analytics available | Low-Medium – content creation and monitoring | Measures audience interaction and content relevance | Content performance and social media strategy | Reflects audience interest; boosts algorithmic reach |
| Net Promoter Score (NPS) | Low – simple survey implementation | Low – survey tools and follow-up processes | Measures customer loyalty and satisfaction over time | Customer experience management and loyalty tracking | Simple, correlates with growth; benchmarks competitor loyalty |
Elevate Your Marketing with Well Web Marketing
This article explored a range of essential marketing KPI examples, from website traffic and conversion rates to customer acquisition cost (CAC) and return on marketing investment (ROMI). We also touched on the importance of measuring email marketing performance, social media engagement, and customer satisfaction through metrics like the Net Promoter Score (NPS). Mastering these KPIs is crucial for any business, whether a small startup or a large corporation, striving for digital growth. By tracking and analyzing these marketing KPI examples, you can gain invaluable insights into your target audience, identify areas for improvement, and ultimately, drive more effective marketing campaigns. This data-driven approach empowers you to make informed decisions, optimize your budget allocation, and achieve a higher return on your marketing investments in 2025 and beyond. Don’t let your marketing efforts be guesswork; let data be your guide.
Ready to unlock the full potential of your marketing strategies using these powerful marketing KPI examples? Well Web Marketing specializes in helping businesses like yours leverage data-driven insights to achieve remarkable results. Visit Well Web Marketing today to learn how we can help you define, track, and optimize your KPIs for sustainable growth.